| Breast Cancer Gene-Expression Miner v5.0
(bc-GenExMiner v5.0) | |  |
Tutorial - Targeted expression analysis
|
|
Targeted expression analysis permits to visually compare gene expression between two or more groups of patients, according to the selected criterion.
A Welch's test is also performed (along with Dunnett-Tukey-Kramer's tests for pairwise comparison when appropriate).
|
|
|
| Step one |
There are two criteria to choose.
Criterion 1:
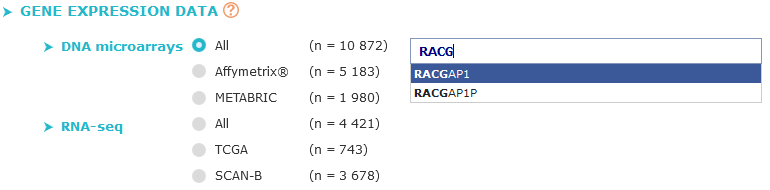
gene expression data
First choose the data source (All DNA microarrays, METABRIC, TCGA...), then fill the textbox with actualised* gene symbol (at least 2 characters must be entered)
or
Affymetrix® probeset ID.
A dropdown list will appear, you can then select the gene you want to test.
The list of available genes depends on the previously chosen data source,
if any option, except "Affymetrix®", is checked only gene symbols available with selected data are shown in list.
If "Affymetrix® platform" is checked only gene symbols represented by a probeset are listed.
Each probeset can be selected, if there is more than one probeset, three additional options are available:
- Median probe: median value of all probesets corresponding to the selected gene is taken,
- Highest probe: the probeset having the highest expression level is retained for the analysis (highest median value in a majority of U133P2 and U133A datasets;
in case of ties, decision was based on the total number of patients in the cohorts.),
- JetSet probe: probeset with the highest score given by
JetSet algorithm.
*: see actualised web databases (e.g.:
Ensembl,
GeneCards,
HGNC,
NCBI Gene...)
|
|
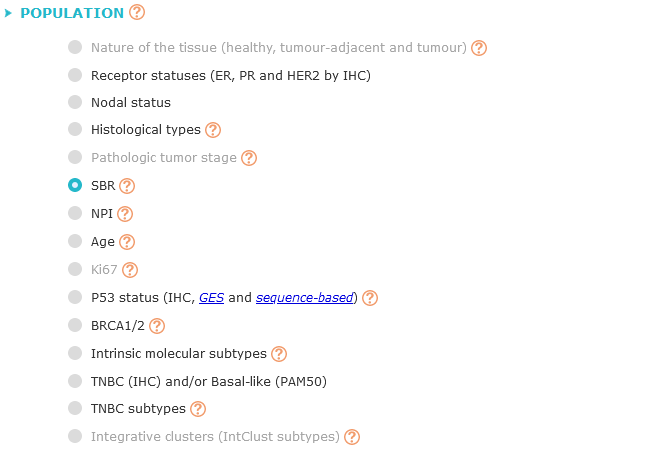
Criterion 2: studied population
Choose one of the characteristics (nature of the tissue, receptors, nodal status, histological types, SBR grade, NPI stage, Age...)
of the cohorts to be explored.
For age criterion, 51 years-old cutoff [≤51 / >51] was retained as age at menopause in western industrialised countries.
These datasets are retrieved from
annotated
genomic data.
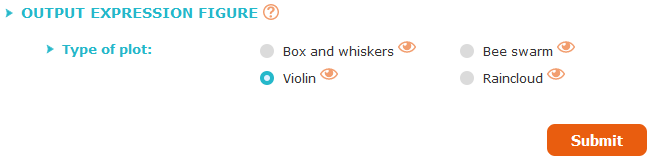
Last criterion: output figure
Each expression plots can be viewed and saved in several formats
To optimize calculation time, only one type of figure will be generated, all are available but only one type at a time.
You have to choose which figure you will get at the results page, by clicking on the appropriate button.
You can preview the type of figure by clicking on the eye logo, a sample will be displayed.
Once all the criteria have been chosen, click on "Submit".
|
Step two |
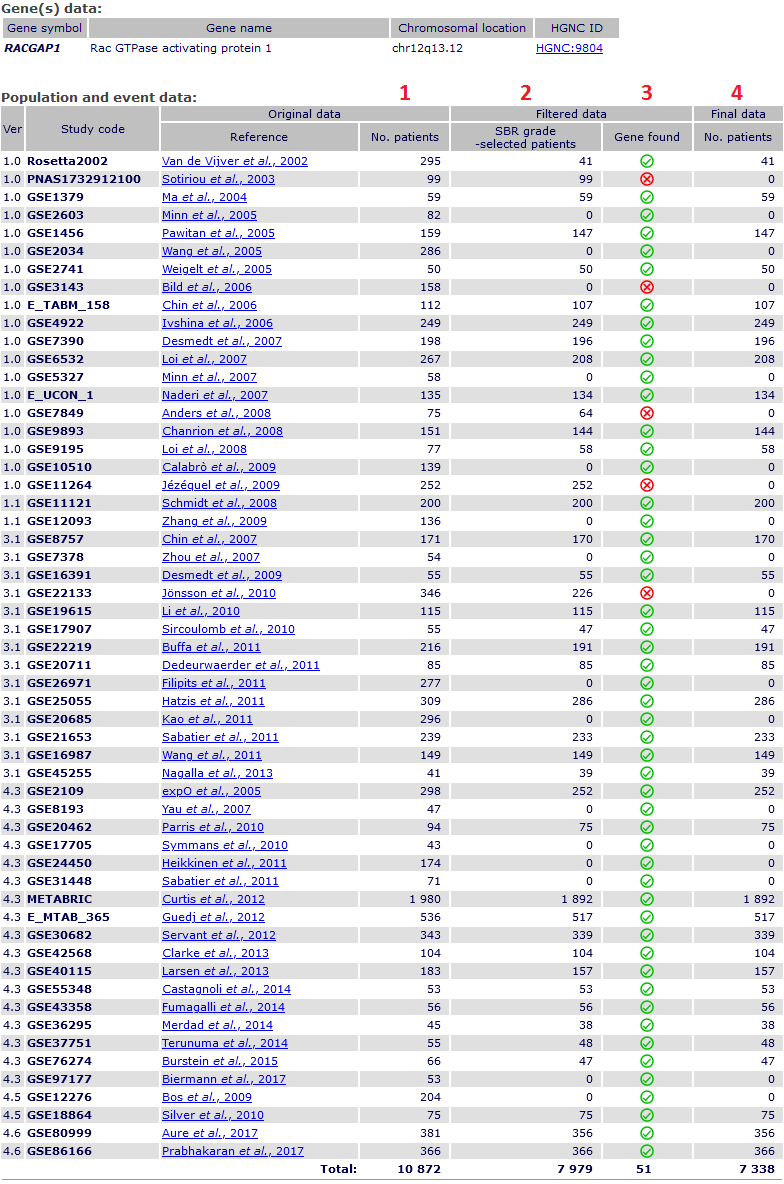
Validation of analysis plan.
After submission, a validation page shows detailed information about:
- tested gene,
- patients from original studies tested,
1 complete data before filtering;
2 results of filtering process;
3 if the gene is present or not;
4 patients finally analysed
(if no missing genomic data).
|
|
|
After visualising the validation screen and reading the summary, at the bottom of the page, you can then choose to validate or cancel your submission according
to these intermediate descriptive data summarized at the bottom of the page.
- "Start analysis" will launch
statistical analyses
with the chosen gene and direct you to expression analysis result page.
- "Cancel" will redirect you back to previous screen, and offer you to choose a new gene.
|
|
|
|
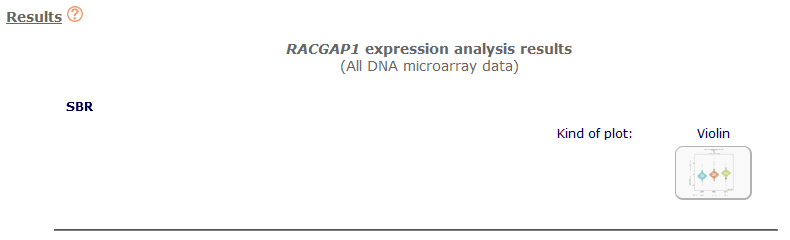
Results are displayed with a violin plot showing distribution of gene expression according to groups. All the types of plots available are:
- box and whisker,
- bee swarm,
- violin,
- and raincloud.
Click on the "plot" button to display or hide the chosen figure. (In this tutorial SBR analysis results was selected)
For age criterion, the case 2 [≤51 / >51 years old] was determined by the age at menopause in western industrialised countries.
|
|
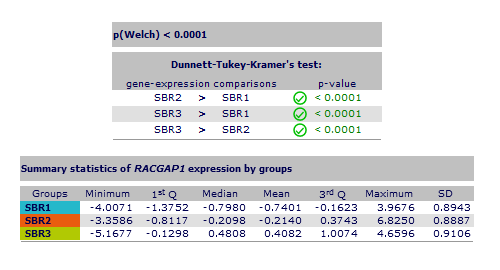
Global significant difference between groups is assessed by Welch's test, the corresponding p-value is indicated on the bottom right of the figure.
If a global significant difference exists (p < 0.05) and there are more than 2 groups, a Dunnett-Tukey-Kramer's test is computed for each pairwise comparison.
The results table is shown below the figure.
Additionally, a second table displays summary statistics data like minimum, 1st quartile, median, mean, 3rd quartile, maximum and standard deviation for each group.
The colour of the p-value depends on the result: the p-value is written in green if a significant difference exists (p < 0.05),
in orange if there is a trend (p = 0.05-0.10)
and in red if there is no difference (p > 0.10).

|
Each expression plots can be saved in "PNG" ([portable network graphics] an universal and easy to use format) or
"SVG" ([scalable vector graphics] a lossless image format figure that allows edit viewing and printing settings, as you wish, for your research article) format. |
|
|
|
|